Basically, the UML Target Debugger will write Sequence Diagrams and Timing Diagrams from the information that the ARXF-CP Framework provides, using the mini-RTE which you can generate like shown in the InteriorLight example. Future versions will support XCP communication and A2L symbolic information as well. This version uses the symbolic information from an XML file that is generated automatically during code generation.
To create the diagrams, the UML Target Debugger needs information. This information is in the model and also in the generated source code. Minimizing the influence on real-time behavior is realized by sending as little information as possible from the target to the host, which is why code is not instrumented. A small Monitor which is part of the RXF is used to send data or receive commands, like setting a breakpoint or apply a filter.
To show the Sequence and Timing diagrams, the debugger uses only small pieces of information which must be sent physically between the Monitor and host
via the Target Debugger Communication channel.
This communication channel is something that must be implemented when adapting the UML Target Debugger for any environment used by any RXF,
like serial, TCP/IP, CAN, JTAG or something proprietary.
When using the UML Target Debugger in AUTOSAR, this requires support of XCP and A2L.
In case of the mini-RTE, the UML Target Debugger uses TCP/IP.
In your Rhapsody Model the RXFAnimation stereotype must be set on your active Component or Configuration. This will trigger the code generator to generate the required XML file and enable the necessary code in the ARXF-CP. Additionally you need to set an RXFMonitorIO_* stereotype to select the communication channel you want to use to transmit data between the Target and the UML Target Debugger. In this example a TCP/IP channel towards the mini-RTE is selected by using the stereotype RXFMonitorIO_WindowsTcpIp.

After setting these stereotypes some additional tags will be added to your Component or Configuration. This is shown in the picture below. Note that the current implementation has Product Restrictions to support the mini-RTE only.

A detailed description on the stereotypes used is described in the section Profiles.
Select Generate/make/Run in Rhapsody to generate source- and configuration files and start Deployment of all these including ARXF-CP sources including Monitor to an IDE environment, where you can build them. When using the mini-RTE you must also have the mini-RTE generated and enabled in the scope, otherwise you will run into build errors.
Do not start program execution yet.

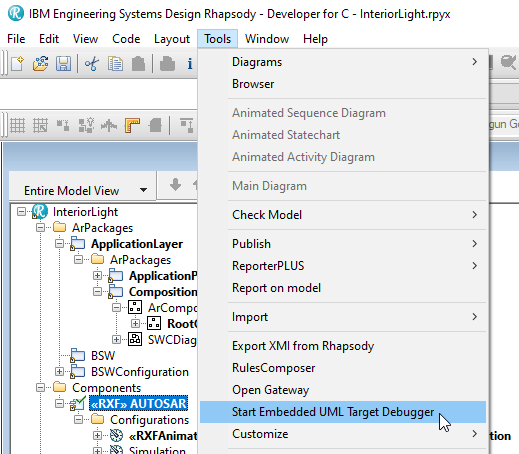
After a successful build, start the Target Debugger:
When using the mini-RTE, the Target Debugger reads the file
This will allow you to specify a port. When you start execution (start the Local Windows Debugger in Visual Studio), you should see a succesful connection:
Note that when changing, you must regenerate sources:
The browser area is split into three parts:
This area shows your selected view as sequence or timing diagram.
Zooming in and out is possible using the mouse wheel, if available. You can change the start tick by dragging inside the diagram with mouse or by using the Zoom control below the timing diagram.
Clicking this button will activate another Window:
To inject an event, you just select the event name, a destination object an press on Inject Event.
Alternatively, you can add an event to a sequence to inject more than one event at the same time.
Events may also have standard type parameters, which are supported by the UML Target Debugger.
Parameters or arguments of events will be displayed as integer values inside the animated diagrams.
Also, event injection with arguments is possible. If you have selected to inject an event which has parameters (defined in the UML model),
a window will pop up and ask for each argument.
The value for each argument will be insert as unsigned int value and cast internally to the real data type of the event parameter.
To change the filter at runtime: please select the Target tab. Here you find a list of all reactive Objects. By enable / disable the depending instance the filter will be switched on / off on the target side.
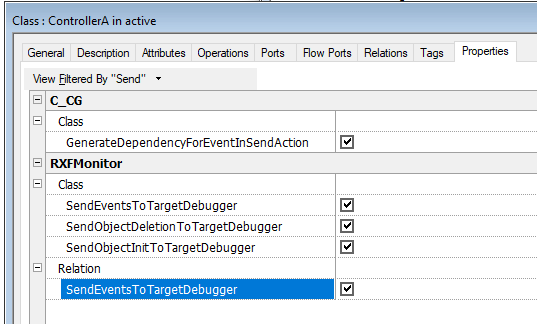
Please use RXFMonitor::Class::SendEventsToTargetDebugger for classes.
This means that all instances of this class will be filtered on target side.
Use RXFMonitor::Relation::SendEventsToTargetDebugger for Parts or Compositions.
This is usefull if you have more than one instance of a class and only want to see the behavior of special instance.
If you set both values on "unchecked" for your active configuration, all instances are filtered on the target.
You can also create a filter for UML events, please refer to the InteriorLight example for detailed instructions.
TCP/IP
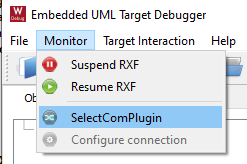
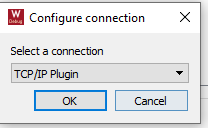
You must configure the Target Debugger Communication channel. Select the TCP/IP plugin to communicate with the mini-RTE:
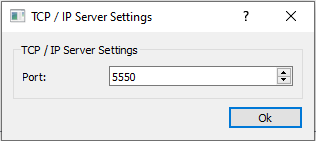

the constant RXF_MONITOR_IO_TCP_PORT changes in a generated List of Defines
and the generated Usage
Browser Area

After the Target Debugger is started, the XML file is loaded and the communication channel was setup and started, the target can start sending information.
The view tab manages your recorded / loaded sessions. You can generate / edit views on your recorded data.
This means you can filter your recorded data by event information: sender / receiver / event type
Additionally you can save and load such filter views or open a selected view in a separate window to compare it with another view.
You can save a selected view as *.csv file to your computer to share it with collegues.
This tab give you control about the target filter. This means you can select at runtime which events and instances are send from Monitor to the Target Debugger host.
This can be very helpful when your model becomes very big and you have to separate which information is send to the UML Target Debugger to avoid a buffer overflow on target side.
Diagram Area

Console

Advanced Features
You can click on an attribute or state: at that moment in runtime, the UML Target Debugger on the host will query the target to send the actual value
- such information is sent only on request by the host in order to reduce the I/O traffic as much as possible.
The information shown on events is actually transferred in a compact way and not as the strings you see, again to reduce traffic and thus runtime disturbance.
The Request for the attribute value or state is send to the target when you collapse the item in the tree view.
Timing Diagrams
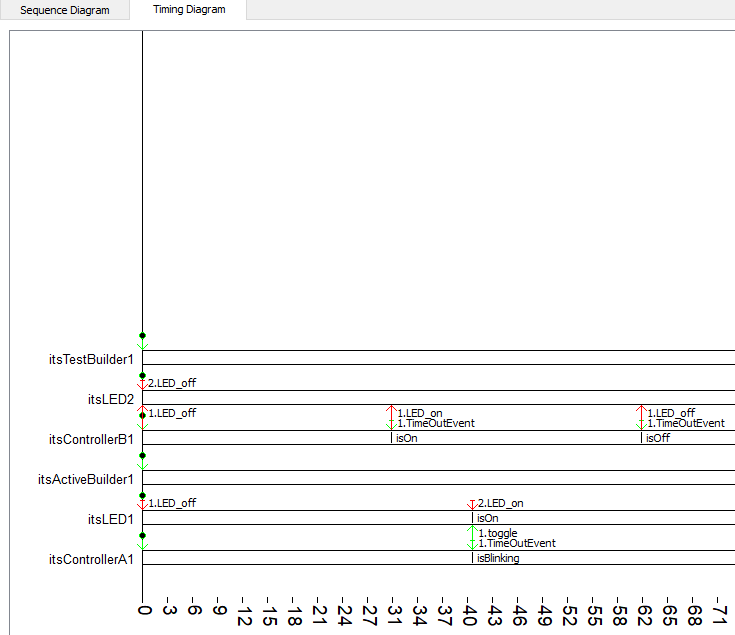
The UML Target Debugger is able to switch from the default sequence diagram view to a timing diagram view.
It is a useful diagram similar to the timing diagrams known from technical data sheets to visualize state changes proportional to the time axis.
Event Injection
It is possible to inject events by the UML Target Debugger to stimulate a specific behavior on the target side:


Filtering
On a larger model, showing all objects and attributes is confusing, because it will not fit in a window and will lead to overhead.
Therefore, we have implemented a filter mechanism on the target side which can be controlled at runtime or compile time.

