
Debugger
Launching a program in debug mode allows you to suspend and resume the program, and inspect variables using the debugger.
You can debug a DXL file directly inside Eclipse. Just right-click Debug As > DXL in the DXL Editor or use a the main menu Debug > Open Debug Dialog to create a launch configuration.
Warning: the DXL file is required to be part of a project defined in the Workspace (i.e. visible in the Project Explorer). Otherwise this menu will be not be available.
You are then prompted to select a DOORS® 'current' module or folder. This is necessary for some DXL files which use the 'current' keyword to perform operations on a specific element.
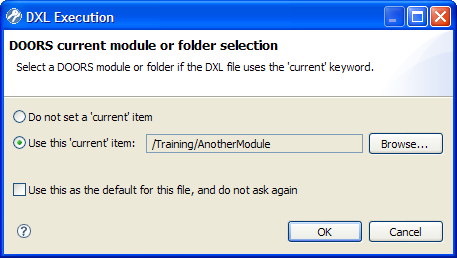
The module tree will automatically expand to show modules currently opened in DOORS®. Such modules will be displayed in bold.
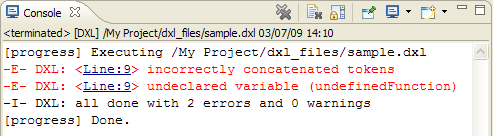
A textual console is opened when a DXL file is executed. This console logs any DXL text output. It also shows the DXL windows that were opened by the executed file. Execution errors are displayed in the console and hyperlinks are available on line numbers to jump to the corresponding location in the DXL Editor.
If you installed breakpoints, the execution will suspend when the corresponding line is encountered.
Remark: The DXL Editor is expected to run locally on the same machine where DOORS is running. Running two instances of DOORS on a single machine, with two different user identities, may result in unexpected behavior.

Adding Line Breakpoints
Suspending Execution
Stepping through the execution of a DXL program

Debugger Architecture
Debugger Known Limitations
Debugger Troubleshooting