Extends M2M IE transformer with JavaScript

As seen in the section JavaScript elements modeling for import and JavaScript elements modeling for export, you can extend your ExportMappingRule or ImportMappingRule with JavaScript source code. The JavaScript instructions are executed during the transformation in the Rhapsody internal JVM, and can be debugged with NetBeans IDE, which is an IDE to develop Java applications or others.

  1. First, download and install NetBeans from this download page: https://netbeans.org/downloads/8.1/

  2. Second, close Rhapsody, and edit the rhapsody.ini file with text file editor to set the Rhapsody JVM in debug mode. Once rhapsody.ini is opened in a text file editor, add the text bellow in blue in the JVM section:

    Options=ClassPath,LibPath,MaxHeap,MaxStack,Debug1,Debug2,Debug3,Debug4

    Debug1=-Xnoagent

    Debug2=-Xdbg

    Debug3=-Xrunjdwp:transport=dt_socket,address=6743,server=y,suspend=n

    Debug4=-Ddebug=true


    Save the file modifications, launch rhapsody.exe, and open the project with the M2M profile loaded.

  3. To be able to connect NetBeans to the Rhapsody JVM, follow these instructions:
    - Open NetBeans IDE
    - Click on the menu Debug->New Breakpoint, and fill in the dialog window like that:
    New breakpoint

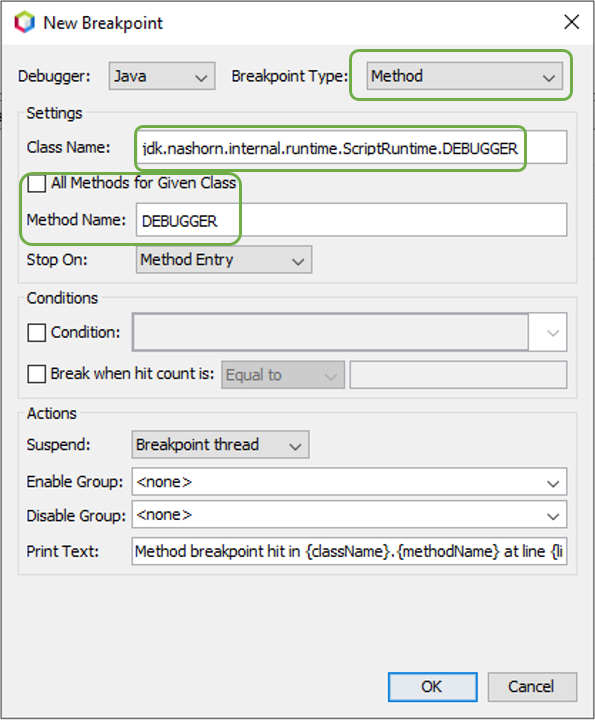
    For the class name, copy and paste this class path: jdk.nashorn.internal.runtime.ScriptRuntime.DEBUGGER

  4. Connect NetBeans IDE to Rhapsody JVM by remote:
    -Click on Debug | Attach Debugger:
    Attach debugger to the JVM

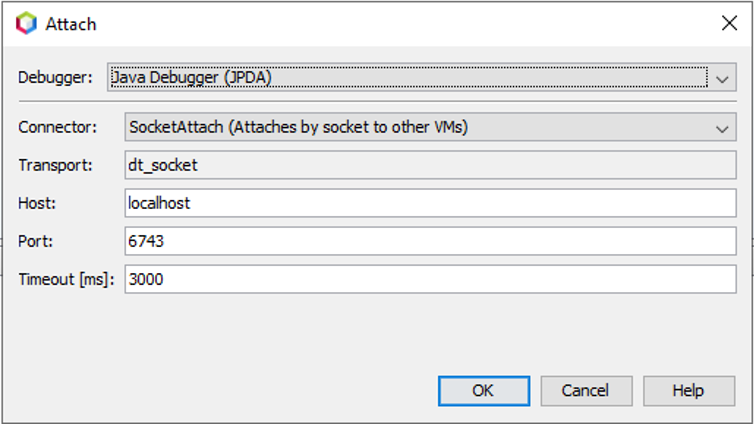
    The Port must be same than the Port opened in rhapsody.ini with the option Debug3=-Xrunjdwp:transport=dt_socket,address=6743,server=y,suspend=n

    -Click on 'OK'. NetBeans is now connected by remote to the Rhapsody internal JVM when the M2M Engine is running.

  5. Add in the JavaScript Function the debug instruction debugger;:
    Debug instruction

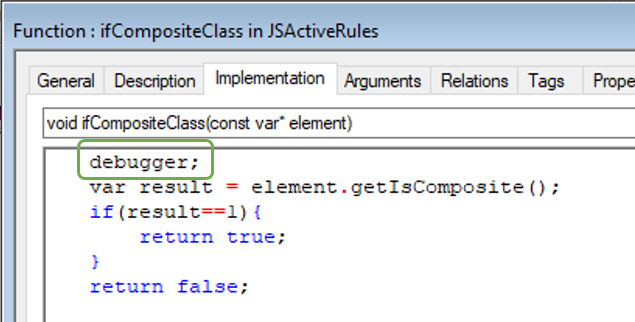
    -Launch the transformation, and NetBeans will stop in debug at this line, and it will be able to debug step by step the JavaScript source code.